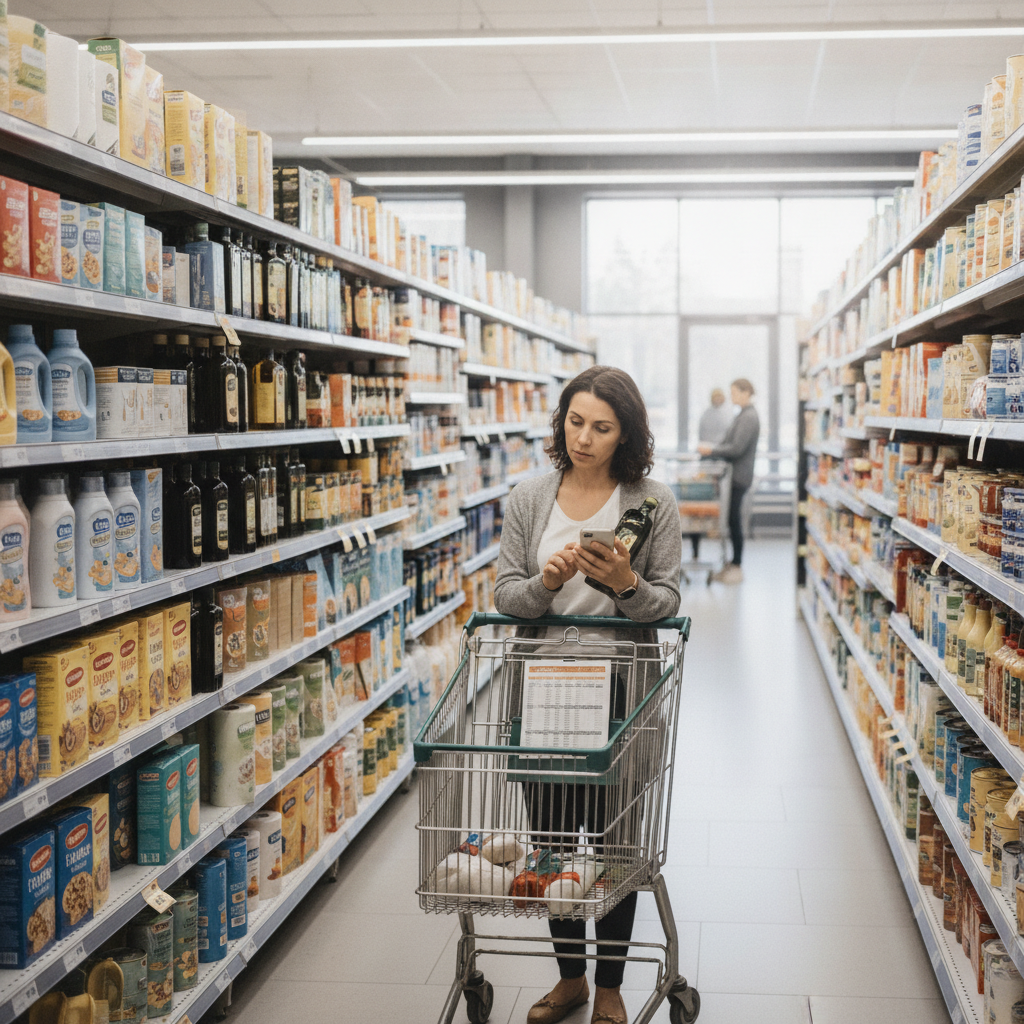
Grocery stores are exceptionally good at making a sale look like a deal when it may simply be the normal price with different signage. Most shoppers have no reliable way to evaluate whether a marked-down price is genuinely low or just lower than a recently inflated shelf price. The practice of tracking unit prices across rolling 90-day windows changes that dynamic entirely — and once the pattern becomes habit, the true sale baseline at any chain becomes surprisingly easy to identify.
Why Unit Price Is the Only Number That Matters
Retail pricing is designed to feel intuitive while remaining genuinely opaque. A bulk buy of paper towels might look like a bargain compared to the single-roll option, but without unit price tracking, there's no way to know whether that bulk price is competitive against last month's shelf rate. Unit price — cost per ounce, per sheet, per count — strips away packaging psychology and anchors comparison to a consistent metric. Chains like Kroger, Walmart, and Target display unit prices on shelf tags, but those numbers shift constantly without drawing attention to the change.
What a 90-Day Window Actually Captures
The 90-day window is meaningful because most grocery chains operate on promotional cycles that repeat roughly every four to six weeks for common staples. Tracking prices across three months captures at least two complete cycles for most categories, which is enough to distinguish a genuine promotional low from a standard mid-cycle price. Items like olive oil, canned tomatoes, laundry detergent, and pasta tend to follow these patterns reliably. A single week of observation tells you almost nothing useful. Three months of consistent unit price logging tells you exactly where the floor is.
The Difference Between a Sale Price and a Sale Baseline
A sale price is what the tag reads on any given week. A sale baseline is the lowest unit price a product reliably reaches within a normal promotional cycle. These are not the same number, and conflating them is how shoppers consistently overpay. The baseline is the price worth stocking up at — the point at which buying extra units before the price resets makes financial sense. Stores like Aldi operate with compressed price variance, making the baseline easier to identify. At larger chains with more aggressive promotional layering, the gap between the sale price and the true baseline can be substantial.
How to Build a Tracking System Without Overcomplicating It
You don't need specialized software or an elaborate spreadsheet. A simple notes app or a shared Google Sheet with columns for date, store, product name, size, total price, and unit price is enough to build a working dataset in 90 days. Focus on the staples your household buys most consistently — cleaning products, pantry basics, protein staples — rather than trying to track everything. Apps like Flipp aggregate weekly circular data and can supplement manual tracking, but they don't calculate rolling unit price trends across stores on their own. That aggregation step is what gives the 90-day method its edge.
How Chains Use Promotional Timing to Obscure the Baseline
Grocery chains frequently raise shelf prices in the weeks before a planned promotion, which makes the promotional price appear more dramatic than it actually is. This practice is especially common around holidays and back-to-school windows when shopper attention is high and category demand is predictable. Without a baseline record, even attentive shoppers have no frame of reference to evaluate whether a 30-percent-off claim reflects a genuine reduction. Tracking unit prices continuously across the 90-day window makes these pre-promotional price lifts visible as anomalies rather than norms, which reframes the eventual sale for what it actually is.
Putting the Method Into Practice Starting This Week
Start with three to five products you buy every month without fail. Every time you shop — or check a circular — log the unit price for those items at your regular store and at one competitor nearby. After 30 days, patterns start to emerge. After 90 days, you'll have a clear baseline for each product and a reliable sense of when prices are at their floor. When unit prices drop to or below the baseline you've established, that's your signal to stock up to your storage limit. You're no longer reacting to a store's marketing — you're making a decision based on your own data. That shift in control is exactly what makes this method worth the modest effort it requires.
Tracking unit price trends across rolling 90-day windows is one of the most straightforward ways to stop letting promotional signage set the terms of a grocery budget. The method works because it replaces a retailer's framing with a shopper's own data, making the true sale baseline visible across any chain, any category, and any price cycle. Consistent tracking turns routine grocery trips into informed decisions rather than reactive ones — and over time, that discipline compounds into meaningful household savings.